FIGURE 2A: Time-series of seasonal temperature anomalies of the lower stratosphere from balloons and satellites.
5. Where is the evidence for global atmospheric warming?
Just like seawater shows oscillations in temperature or content of sensible heat, the atmosphere, too, is subject to long-term oscillations in energy content, including sensible heat and its measure by temperature. In fact, the evidence indicates that the atmosphere undergoes regular periods of cooling and heating, both near the ground and all the way up, through the troposphere, to the tropopause and the stratosphere. The scientific evidence collected over the past 50 years suggests that there are periods of cooling and warming superimposed on cycles of various scales, and that these variations are connected, in ways not yet understood, to solar periodicities, geothermal energy, varying atmospheric electricity and latent heat, and varying cloud cover and cloud composition. As suggested by a number of investigators (viz. Richard Lindzen, Willie Soon, Sallie Baliunas, etc), these cycles may also involve negative feedback, likely through diverse physical processes - chemical ,evaporative, radiative and electrical.
Temperatures of the atmosphere close to the surface have had oscillations of a secular character - a fact that for some time now has been recognized by glaciologists, paleoclimatologists, archeologists, etc. Changes in the amount of heavy oxygen isotopes (which is proportional to the amount of ice) in marine fossils have been correlated to three separate cyclic changes in the movement of the Earth with respect to the Sun, to produce the so-called Milankovich model of climatic periodicity: a 90-100k-year periodicity associated with variation in the orbital eccentricity; a 40k-year cycle associated with the tilt of the Earth's axis; and a 21k-year periodicity associated with the wobble of the axis. Between 83 and 18k-years ago, a 'great freeze' seems to have taken place, and it is commonplace to infer that our epoch lies near the end of an interglacial that began some 12 to 10k-years ago. Within this interglacial, it was apparently warmer at earlier times, for example in the period of 850 to 1250 AD (so-called Little Climactic Optimum), than it is today. A recent study of the last 1,000 years by Willie Soon et al, concluded that "many records reveal that the 20th century is likely not the warmest nor a uniquely extreme climatic period of the last millenium" [13].
|
|
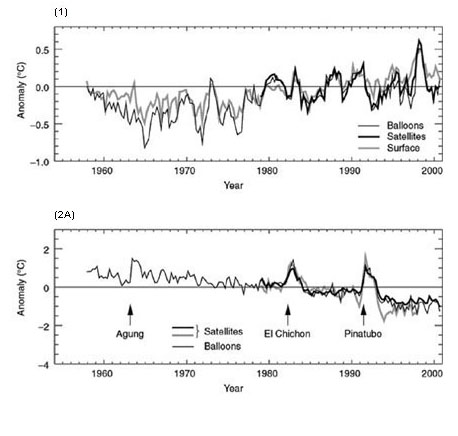
| FIGURE 1 (top): Time-series of seasonal temperature anomalies of the troposphere based on balloons and satellites in addition to the surface. FIGURE 2A: Time-series of seasonal temperature anomalies of the lower stratosphere from balloons and satellites. |
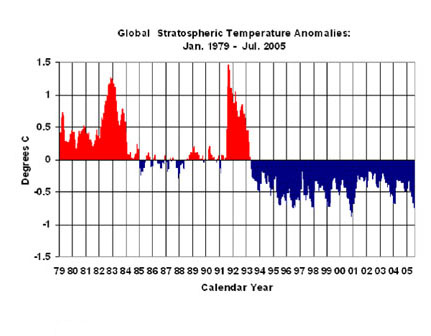
Moreover, satellite and balloon curves [FIGURES 2A & 2B] for the stratosphere present a distinct and steady 4 decade cooling from 1958 to 2001, only interrupted by volcanic eruptions [16]. Even that is likely not a trend but a periodic oscillation. Indeed, a graph of the average monthly temperatures, from 1979 to 2005 (at www.ghcc.msfc.nasa.gov/MSU/msusci.html), presents no trend per se, just a steady mean 'cool level' on the order of -0.5 deg C since 1993. Yet, this stratospheric cooling 'trend' is presented not as something that contradicts 'global warming', or even compensates for it, but as something 'believed' to be caused by ozone depletion. This, too, is somewhat ironic, since nowhere do the acolytes of 'global warming' attribute the excess heat of urban environments to increasing concentrations of ground ozone caused by man-made pollution! Yet, if ozone depletion can account for stratospheric cooling, urban warming could just be the result of excess ground level ozone!
 |
|
|
FIGURE 2B
|
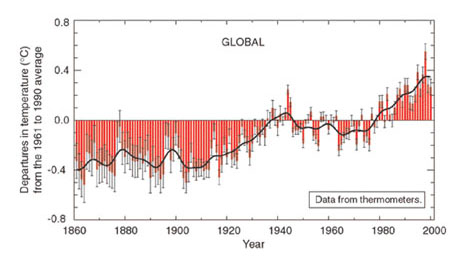
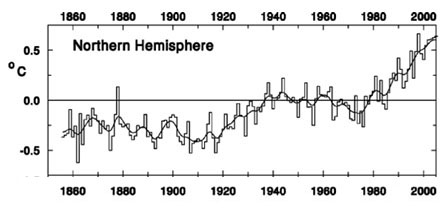
From that IPCC graph, one may conclude that a 4-decade warming 'trend' (by ca 0.5 deg C) from 1905 to 1945, was followed by a cooling 'trend' (by ca 0.2 deg C) from 1945 to 1968, and this, after a 'lull' in the variation from 1968 to 1972, was followed, from 1976 to 2000, by the current 'trend' with a temperature increase on the order of 0.6 deg C - or a rate of warming of 0.2 deg C per decade.
However, first of all, all these curve trends, aside from being composite and including some form of a doubtful ocean warming curve, are referenced to the 1961-1990 average of the three curves, despite being part of a graph that spans from 1860 to 2000. Though choosing a longer term average would increase the relative amount of observed increased warming, it would more strongly suggest that positive (warming) and negative (cooling) oscillations have comparable amplitudes about a better or longer-term mean, thus decreasing the likelihood of a significant anthropogenic contribution to warming (and suggesting that, if one exists, then man-made factors must also have a comparable short-term contribution to cooling, thus adding to either of the natural variations, or intensifying them).
 |
|
| FIGURE 3: Combined annual land-surface air and sea surface temperature anomalies (C°) 1861 to 2000, relative to 1961 to 1990. Two standard error uncertainties are shown as bars on the annual number. |
Secondly, even at face value, the composite IPCC curve clearly indicates that there are supradecadal oscillations, suggesting that the present supradecadal warming 'trend' is likely at its temporal end.
Thirdly, one should keep in mind our above criticism pertaining to modelling of 'overprocessed data' in recent oceanographic studies, and in particular how smoothing curves, weighting averages, infilling data, etc, are arbitrary procedures for which a mathematical rationale and a model can always be constructed. What should count is a physico-chemical foundation for that rationale, and that is precisely what is systematically missing from these voluntaristic models. Undoubtedly, there is a chance that partisans of 'global warming' could be right, and the composite curve could take off and go northward. But this is not a chance with a high degree of probability, nor even a chance that lies above a significant threshold of correlation. It is a very slim chance indeed, and one that needs to invoke the specter of a constant positive feedback mechanism in order to sustain its faddist projections. Yet, there is no shred of evidence for such positive feedback. While accepting a 50% increase in CO2 and a global warming since the 1970's on the order of 0.5 deg C, Lindzen bites on these exaggerations:
"On the basis of models that predict a 4 deg C warming for a doubling of CO2, we might expect to have seen a warming of about 2 deg C already. If, however, we include the delay imposed by the oceans' heat capacity, we might expect a warming of about 1 deg C - which is still twice what has been observed."
Once again, there is no substitute for going back to the roots of real and basic science: the raw data must be re-examined.
 |
|
|
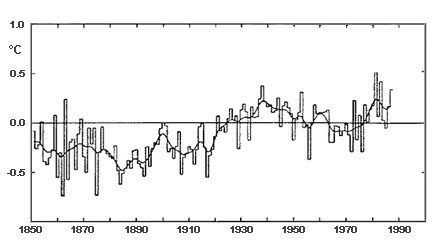
FIGURE 4
|
|
 |
|
|
FIGURE 5
|
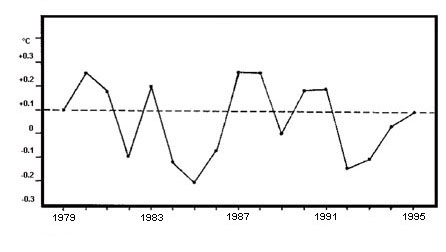
When one compares the mean annual surface air temperature curve of P.D. Jones for the Northern Hemisphere [FIGURE 4][18] with the composite Northern Hemisphere air curve that includes sea surface as provided either by IPCC (and the World Meteorological Organization, WMO) or the Climate Research Unit, CRU (UK) [FIGURE 5], one notes that the fundamental difference, all else aside, is the determination of the mean: Jones took the mean from the 1951-1970 period, whereas IPCC and CRU took the mean from the 1961-1990 period. With the lower position of the reference mean, however, the maximum oscillation of the smoothing mean does not exceed 0.5 deg C (a single instance in 1885) - and peak annual variations do not go past 0.65 deg C (in 1864). If one considers, instead, the CRU curve, the moving average curve reaches 0.7 deg in 2005, flattens the observed variation (in warming and cooling) between 1930 and 1950, and slopes the curve of the mean progressively higher with time. One could, of course, go once more over all the rationales (exclusively modelling and statistical rationales, not physical and chemical) for the CRU and IPCC curves, and as to why Jones' method had to be 'superseded' - if, for no other reason, than because 'more, better and newer' data had 'arrived', from 1987 to 2000 (CRU includes data up to the present). Yet, annual means from satellite observations of the global mean air temperature in the lower troposphere, made from 1979 to 1995 and free from the thermal distortions imposed by the 'urban heat island effect', present a very different story [FIGURE 6] [19-21]: a distinct, typically 3-year long, quasiperiodic oscillation of alternating warming and cooling is observed, with amplitudes no greater than 0.3 deg C (see an instance of cooling in 1985). This cyclic variation in the data is obliterated by the data processing of General Circulation Models (GCMs) employed by IPCC and GRU, which are neither fine enough to resolve those short-term cycles, nor capable of accounting for them. Until the processes behind such short-range oscillatory patterns are understood, little can be hoped for from loaded axiomatic extrapolations.
Very recently, on August 12, 2005, Rupert Murdoch's trashy daily USA Today ran a feature article entitled "Scientists find errors in global warming". Penned by a dimwit called Dan Vergano, the 'article' reports that Science had just released 3 papers that confirmed global warming (yes, we know, the title 'errors in global warming' does not seem to be very confirmative, but that's Murdoch-style 'journalism'...). In fact, the USA Today article is a digest of another digest, an anonymous Economist item (the Economist is owned by the The Financial Times) from the day before (August 11th), entitled "Heat and Light". Neither article provides references to any of the claimed 3 papers.
 |
|
|
FIGURE 6
|
The digest of all 3 papers constitutes a perfect denial of our own very argument above - that the warming 'trend' is short-lived, neither on the order of the claimed 0.20 deg C per decade, nor necessarily caused by anthropogenic factors, and that satellite and balloon data contradict the surface 'trend' claimed by 'global warming' apologists. Indeed, after much massaging of the weather balloon and satellite data for the troposphere, the partisans of global warming managed to squeeze out of them an insignificant temperature increase of 0.09 deg C per decade. This was clearly not good enough for their dogmatic assertions. So in came Carl Mears and Frank Wentz of Remote Sensing Systems, collaborators of militant 'global warming' modeller Benjamin Santer from the Lawrence Livermore National Laboratory, to perform a rescue operation [22]. They believe, they tell us, that there must be some warming of the atmosphere and that the satellites are just not giving us the right data. It is worth quoting from the Economist:
"It [ie the apparent atmospheric cooling detected by satellites] is caused, they believe, because [sic] the orbital period of a satellite changes slowly over that satellite's lifetime, as its orbit decays due to friction with the outer reaches of the atmosphere. If due allowance is not made for such changes, spurious long-term trends can appear in the data. Dr Mears and Dr Wentz plugged this observation into a model, and the model suggested that the apparent cooling the satellites had observed is indeed such a spurious trend. Correct for orbital decay and you see not cooling, but warming."
Orbital decay is hardly news, since it has been known ever since man attempted to put an artificial satellite into orbit, and corrections for it have long been entered in altitude calculations. Mears and Wentz, however, find, with a mouse click, the model adjustment required by 'global warming': with a new 'systematic' correction in place, the decadal increase in temperature now becomes 0.19 deg C, near the value claimed by global warming apologists for the increased warming of the Earth's surface - and finito the contradiction! This sure ain't science, even if it's called Science. And there's more. As members of the Santer club, Mears and Wentz are part of of Science's next feat: a paper by Santer et al demonstrating how the disagreements between 'global warming' models is due to data that has not been properly treated (read blanched or patrolled by fellow zealots) [23]. So far, this is all just more modelling crap. But that's not the end of the goodies offered by Science.
Not to be outdone, a third study reports a second (!) systematic error in balloon measurements of temperature which is said to be due to uneven heating by "tropical sunlight" of instruments from diverse manufacturers [24]. To compensate for such heating, routine correction factors are applied. Now Steven Sherwood et al report that daytime data was systematically overcorrected across all these decades of measurement. They conclude that balloon data is so unreliable that one cannot doubt the atmosphere is warming - though by how much cannot really be determined (!) if one uses balloon data. The net result of this fudging is that the decadal rate for tropospheric warming, in Sherwood et al's expert hands, rises from the insignificant 0.09 deg C to the warming-corroborating but still insignificant 0.12 deg C...
That's enough, however, for the mediocracy of USA Today to declare, on August 12, 2005, that the peer-review-certified Science "results" (modelling corrections...) demolish "the last bastion of scientific doubt" about 'global warming'! The results were blessed by Science and sanctified by the Murdoch empire. All in keeping with Rupert Murdoch's intent, stated explicitly on May 15, 2003, as aiming to bring the quality of American media analysis down to the level of a nouveau-maoist party line:
"As someone who was born in Australia and who is married to a woman from China, I feel that I and my Australian-owned news sources are the most qualified to present the true American perspective on things. (...) Between my down-under upbringing and her Red China view of things, we come up with the real American perspective, like no actual American possibly could. (...) I know the true voice of America, like no American possibly could if I didn't spell it out for them on a daily basis. (...) I would love to fully and completely own the entire American media. Just this past week the U.S. Congress was holding hearings about allowing even greater ownership of the media by a single entity. It is just a matter of time before I am allowed to weed out all of those un-American American-owned news sources and ensure that America is provided with nothing but the real American view of things, as determined by this Aussie and his lovely, wonderful wife from China."
Who's taking who for a ride? Yes, Murdoch is funny - in a macabre sort of way. Members of the international mediocracy, the true rulers of the present global system, speak for the 'down-under' as Chairman Mao Dze Dung once did: swallow the bitter pill of 'global warming', and get the remedy from science; pardon us, from Science, from the American Association for the Advancement of Science. Ain't that sweet? Murdoch and the advancement of science. More American than any American. The global dictatorship of the mediocrats.
In January 2005, Roy Spencer of NASA had written [25] :
"A scientific report on what this apparent discrepency [sic] between the satellite and surface data means in the context of global warming theory will be completed in 2005 as part of the US Climate Change Science Program."
Now we know how the "discrepency" was resolved - by the introduction of still more fudge factors.
The immediate question that surges to one's mind is: how can so much trust be put by scientists into data that has so many systematic and diverse errors associated with it - errors in collection, errors in processing, errors in intrinsic parameters, errors in calibration, etc? And then, how does such dubious raw data get dubiously processed in order to provide 'evidence' for what it still does not prove?? Any sane individual will be left wondering - after thousands of papers, and a veritable Niagara Falls of them in Science - where is the evidence that would prove that there is global atmospheric warming??
The hypothesis of 'global warming', now so often enshrined as 'fact', has been called junk science. It is indeed junk, and if its reasons to exist are both political and economic, the 'evidence' for its supposed veracity has been fabricated piecemeal by official scientists - read: technobureaucrats - who have gravely departed from the scientific method. Many weather stations do not have complete records for the 1961-1990 period used to determine the global mean, so methods were employed to estimate these values from neighbouring records or inferences. Over the oceans, the data could not be organized for fixed or repeating points, so inferred data was interpolated. The composite land and marine surface data takes values from each set, and in the case of the CRU analysis, it is 'weighted' in latitude/longitude grid boxes, by area and neighbouring values, with so-called 'infilling'. Also in the CRU model, 'variance adjustment' is carried out relative to an underlying 30-year timescale trend, whose establishment requires estimation of grid box temperatures into the future (beyond the end of each record, including the present)! Furthermore, in the same model, the so-called thermal anomalies do not average to zero in the period of reference - though this results in a lower mean baseline. The truth is that even collection of basic data raises many questions as to the validity of the data - simple questions like: why hasn't the data been generated differentially for urban, rural and wildlife environments? Or for cyclonic versus anti-cyclonic conditions? Or between anticyclonic days of the burst type versus nonburst type [26]? Or why hasn't it even been properly integrated as to the time of day?
One of the grimmest jokes that passed itself off for science in the pages of Science, was a statement from the 2001 Levitus et al paper. It's a riot: "Estimates of the melting of continental glaciers (Antarctica and Greenland) range from -1.8 to 1.8 mm of global sea level change per year [the provided reference for this statement is ICCP 1995]. Using a value of 1.8 mm per year, the amount of heat required to melt...etc" [27]. In other words, a reference to a biased study now suffices as replacement for any actual gathering of data! Further, when a range is given, no quality or statistical qualification needs to be attached to the polar figures of the range. Then, if the range were real, the mean change would be 0 mm per year. Lastly, as neither 0 mm, nor -1.8 mm of change would require, presuppose or justify the notion of increased melting of the polar ice caps because of 'global warming', only the value of +1.8 can be, and will be, employed. After all, no other value would permit the supposition of melting, the "required to melt".
With such modeling gimmicks, militants of 'global warming' establish the conclusion that any skepticism concerning the myth is both undeserved and suspect... They are the unwitting and not-so-unwitting tools of global mediocracy.
In closing this section, we should mention that a 2000 study at 9 selected weather stations distributed across Canada, since their inception and spanning periods of 50 to 150 years, failed to detect increased temperature at any location, urban and rural, except in Toronto, and marginally in Moncton and Indian Head [28]. No evidence either was found for a trend of increased precipitation, save for Moncton. Of course, had the study examined Vancouver in 2004-2005, they would have found increases in both temperature and precipitation, for the problem of 'global warming' is most fundamentally the problem of atmospheric pollution in cities, in urban environments, particularly growing ones. Curiously enough, the posture of the ideologues of 'global warming' is to admit half-heartedly that local climates may be cooling while insisting that the global climate is warming.