 |
|
|
FIGURE 7
|
6. The case for the increase in atmospheric carbon dioxide
We now come to the fulcral question: is there evidence that the concentration of carbon dioxide has increased in the past 100 or 200 years? Here begins the story of one of the most egregious instances of scientific skulduggery. All begins in 1958 with George Callendar's dubious treatment of carbon dioxide data [29]. Callendar arbitrarily discarded, amongst other things, all measurements above 350 ppmv (parts per million by volume), most measurements above 320 ppmv, and all measurements taken in city environments (not even a comparison between rural and urban environments was carried out) - to arrive at the notion that the mean carbon dioxide concentration during the 19th century was 292 ppmv. Inclusion of the data discarded by Callendar would have placed the 19th century carbon dioxide mean 15% higher, at 335 ppmv [30]. If one accepts the Callendar treatment of the data, one accepts that there has been an increase in carbon dioxide in the past 100 to 150 years (but not in the 100 years before that), ie an upward variation of at most some 21% - from 292 ppmv to a maximum of 350-355 ppmv. This is an essential tenet of 'global warming', but it is noteworthy that some critics of this myth accept this variation, or the existence of a variation that may be as high as 25% (eg Jorgensen) or 50% (eg Lindzen). Typically, this increase is explained by deforestation (preponderantly before 1905) and increased fossil fuel burning (after 1905) - by coal-burning plants, internal combustion engines, etc.
It is obvious that, if one accepts instead the value provided by Giles Slocum [30], the increase in carbon dioxide is either of threshold significance (ca 7%), or actually nonexistent. This is the position of other critics of 'global warming' - viz. Zbigniew Jaworowski - who assert that there is no evidence for the observed increase being significantly different from the variations recorded in the past, in the compiled data for the last 200 years and in the fossil record [31]. But the militants of the 'global warming ideology' do not limit themselves to defending the Callendar manipulation of the data, they further hold that for the past 10,000 years the carbon dioxide concentration remained below 270-290 ppmv. Once more, these are grandiose statements based on flimsy data, if any at all. Stomatal frequency in fossilized Holocene leaves suggests that levels of carbon dioxide reached 310 and 325 ppmv, respectively, at 8700 and 7,800 years BP, with decreases of 25 ppmv between 8,400 and 8,100 BP [32]. Still others have reported levels on the order of 333 to 348 ppmv at 9,600 to 9,800 years BP [31]. Furthermore, the inconsistency between such fossil studies and the lack of Antarctica ice-core data supporting a temperature-CO2 correlation during the Holocene is explained by a variety of physico-chemical processes, including the presence of liquid water, in the air bubbles trapped in ice crystals of polar ice cores, which effectively falsify the use of the carbon dioxide content of such air inclusions to construct a record of its past concentration [34]. Moreover, "formation of CO2 clathtrates starts in the ice sheets at about 200 meter depth, and that of O2 and N2 at 600 to 1000 meter depths. This leads to depletion of CO2 in the gas trapped in the ice sheets. That is why the records of CO2 concentration in the gas inclusions from deep polar ice show values lower than in the contemporary atmosphere, even for the epochs when the global surface temperature was higher than now" [31]. So much for using the evidence from ice-cores to show that with respect to the past, there has been a 25% increase in atmospheric CO2 content. And so much, also, for the rigid view that before 1850 or so, the CO2 concentration was stable and at 270 to 292 ppmv. This is nothing but more hogwash not sustained by actual data.
From the perspective of the present authors, the simple fact is that there is no data on which to reliably base any meaningful statement about the CO2 content of pre-1945 terrestrial epochs. The data is tentative and subject to interpretation - thus the best interpretation must be cautious and must not place too much stock on any one value, trend or statement. The existing data, even post-1945, is widely diverse in the methods employed for its collection over the period of 200 plus years, different in reliability, in quality, even in the real nature of the scientific interest or dedication of those who collected it. There is no doubt that combustion of fossil fuels is generating massive quantities of CO2, along with carbon monoxide, unburned carbon compounds, lead vapour, sulphur aerosols and oxides of nitrogen. The present authors are not in the pay of any of the Oil Sisters and have never been, nor will be. We have, in fact, no intent to deny or downplay the toxic ill effects of the oil, coal and nuclear industries - their poisoning of the air we breathe, the water we drink, their destruction of the environment, their threat to ecological habitats or their causing of countless grave ailments, not to mention wars. In fact, the reader should ask hirself why it is that oil, coal and nuclear companies now embrace the green movement, agree with the tenets of 'global warming', and are so intent on spending to reduce CO2 emissions - and in the same breath of (polluted) air, also ask hirself why it is that all these militants of the ecological anti-'global warming' movement are so averse to the non-polluting energy technologies invented by these authors; in fact, as averse to considering them as the Oil Sisters are. Is there a link here too? A good question indeed.
But our concern here is the hocus-pocus of CO2-induced 'global warming'. It could be true - and certainly CO2 pollution is real enough in our cities and urbanized territory. As real as the incessant traffic noise. But the data presented by adherents of 'global warming' is not convincing because it is the product of too much forcing - a forcing of the CO2 concentrations, a forcing of what they do and do not mean, a forcing of the effect of CO2 upon temperature. Yet, despite all these forcings - or because of them! - no real science can be squeezed out...
The parody is so intense that a recent third-rate study on the categorical 'Antarctica warming', by two technobureaucratic 'scientists' (one of whom is a civil servant with the British Antarctic Survey), "studied" (sic) simulations by 3 different 'global warming' models and actually "reported" that none of the models produced the desired warming (ie "a significant enhancement in warming"), "even with enhanced forcing" (what a pleonasm! - even with forced forcing...) [34]! That 'enhanced forcing', incidentally, did not yield warming either, even when the CO2 concentrations were greatly accelerated (some modelling!). The same pseudoscientific study then concluded that either the unquestioned Antarctica warming which will occur over the next century "is a response to forcings not included in the models or that the [Antarctica] Peninsula is sensitive to effects poorly modelled". In other words, by the models of 'global warming', there shall be no warming over Antarctica in the next century... Yet, even when the model of warming does not generate nor predict warming, the warming is still somehow there, to be believed in, to be marketed - it is just modelling that needs a facelift, just as the modeller needs job security in an age where that is now past.
|
|
|
FIGURE 7
|
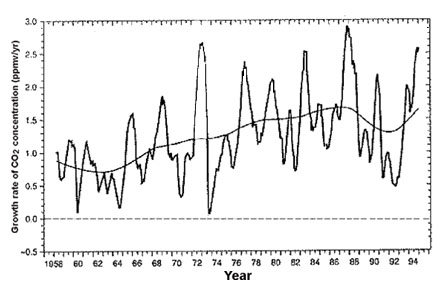
Now, let's take a dispassionate look at the Mauna Loa data for the variation of the annual growth rate of lower tropospheric CO2 content from 1958 to 1995 [FIGURE 7] [35]. It presents a pattern of annual and biennial variation that suggests a short term negative feedback control, not a positive one. Also, though the moving average rises, from 1958 to 1995 the rise merely goes from a rate of 1 ppmv/yr, to 1.6 ppmv/yr, on the threshold of being both an insignificant growth rate, and an insignificant variation of the growth rate.
Now see what the fanatics of 'global warming' do with the the Mauna Loa curve. You're about to contemplate one of the greatest frauds in the history of science.
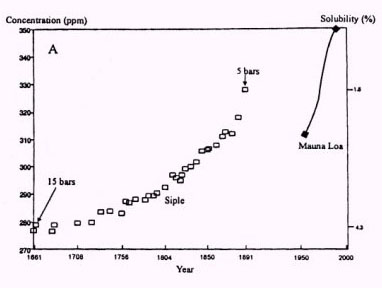
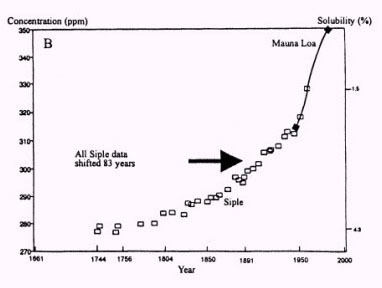
Indeed, perhaps there is no more poignant mystification or forced falsification of science than the so-called Siple, Antarctica curve - not the original curve of the data taken at Siple per se, but the curve which has become the banner of the Big Warming zealots. Jaworowski's presentation to the US Senate unwrapped this mega-fudge cake, which was stamped and approved by Official Science and its peer-reviewed publications, with the vanguardist Science at the forefront. Jaworowski first presented the data for CO2 from ice cores taken from Sipel in Antarctica [FIGURE 8][36-37]. This curve, spanning 1601 to 1901, is used generally as proof of the anthropogenic nature of the CO2 concentration. Yet, Jaworowski found that it presents a nearly linear inverse correlation with the pressure (from 5 to 15 bars), that is, with the recorded and variable depth of the cores employed to collect the data! Be that as it may, Big Warming zealots desperately needed to relate the Siple, Antarctica curve to the atmospheric readings at Mauna Loa from 1958 on - which were performed a mean 83 years later (1973-1890=83) than the time the ice last probed in the Siple curve had been deposited (1890) [FIGURE 9]. By royal decree [36-37], subsequently stamped by the IPCC, an ad hoc assumption was made with no evidence to back it up, and the problem of relating the two curves was simply and 'elegantly' solved: even though a core was formed, for example, in 1890, the air trapped in it was not as old as the ice, but younger by exactly...83 years! So the curve was moved upscale by 83 years and aligned with the Mauna Loa record to give the illusion of a staggering, steady increase from 280 ppmv in 1744 to 350 ppmv in 1973.
 |
 |
|
|
FIGURE 8
|
FIGURE 9
|
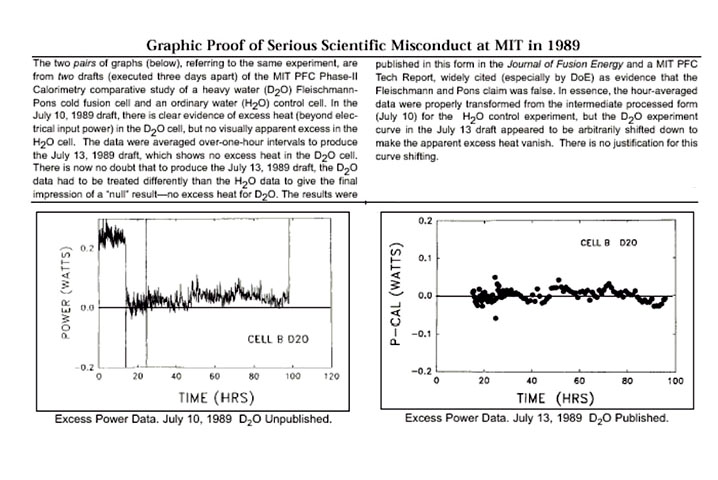
This procedure of mainstream climatology sanctioned by IPCC in 1990 is an outstanding example of pseudoscience employing sheer arbitrariness and outright forgery of the data record to establish a 'scientific' dogma - a falsified Siple curve, made official by a supranational institution of Official Science. The blatant moving of a curve along the X-axis of time to fit the desired result has perhaps only one other parallel falsification in the recent history of science: another institutional event of Official Science, one that moved a curve along the Y-axis of energy (heat) to raise the baseline and conceal the anomalous heat from a cold fusion cell. This took place in 1989, and the whistleblower was a vertical man, a scientist, science-journalist and engineer who would later become a very close friend of the present authors - Eugene Mallove. The subject was room-temperature fusion, aka 'cold fusion', and Mallove, in charge of the MIT news office, was at the time a 'cold fusion skeptic'. But when he studied the data from MIT's attempt to reproduce the Pons-Fleishmann experiment, he realized that the baseline line (or control curve) had been delberately shifted by an amount required to render the small excess heat null [FIGURE 10][38]. When Mallove blew the whistle, and no corrective action took place (in fact, the graph in question was simply suppressed in the final publication of the MIT report), he resigned his MIT job in protest. Here a forgery, a fudge factor, was employed to deny the existence of a phenomenon; there, in the Siple curve, a fudge factor, a forgery, was employed to 'prove' the existence of a phenomenon. In both instances, Official Science availed itself of zealots, of scientists who have become technobureaucrats, and who will do whatever it takes to prove a desired point - either that global warming exists, or that room-temperature fusion does not. In the first instance, a veritable pseudoscience is promoted into the hall of fame of Official Science; it acquired status. In the second instance, science, a nomadic or eccentric science, was demoted into the pit of disgrace and treated officially as if it were pseudoscience. Two different outcomes of the same anti-scientific lunacy, of the same ideological scientifism. Two more examples of the socially adverse effects of allowing the logic of power to rule the world of science impunely, and beat us all into submission with the sticks of Official Science and 'mainstream consensus'.
 |
|
|
FIGURE 10
|
Of course, there is no doubt that CO2 is constantly released in great quantitities from automobile engines, coal-fired plants, natural gas plants, etc, along with other still more noxious pollutants. What happens to it, what conversion cycles it may engage in, what, if any, is the evidence for a negative feedback atmospheric response to its increased cconcentration, etc, are all good questions - questions where little investigative effort is being spent, questions that do need answers, and answers that the promoters of Kyoto do not really want to know.